More and more investors insist on guarantees on the investments. Theses investments are often created using options or dynamic strategies like CPPI. Recently, these strategies were made available in secularized form: Leveraged Exchange Traded Funds (LETF) and Exchange Traded Notes (ETN). Also, life insurance instruments often include guarantees on funds like Variable Annuities. In this article, we will look at the change in stock price dynamics due to hedging activities.
Overview
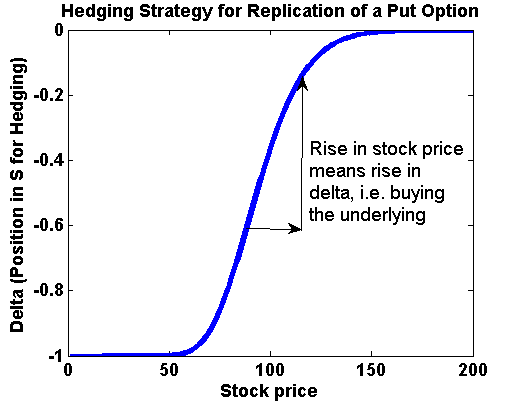
We will look at hedging of a popular put option. In a previous article about pricing and hedging of options, we saw that the issuer can replicate an option sold using a hedging strategy. For replicating a put option the issuer has to buy the underlying if the price rises and sell if the price is falling. (By the way: This is also true for call options, but here, we focus on puts to keep it simple.)
Case Study: Hedging a Put Option and Market Feedback Effect
In this case, we use Theta Suite and ThetaML for analyzing the market feedback. First, we need the trading strategy, which is available in closed form:
model EuropeanPutAnalytic
 import S "Stock price"
 import K "Strike price"
 import Sigma "Volatility"
 import R "Interest rate"
 import T "Maturity time"

 export V "Black-Scholes price"
 export Delta

 d1 = ( log(S/K) + (R + (Sigma^2)/2)*T ) / (Sigma * sqrt(T));
 d2 = d1 - Sigma*sqrt(T);

 V = -S * normcdf(-d1,0,1) + K * exp(-R*T)*normcdf(-d2)
 Delta = normcdf(d1,0,1) - 1
end
Now, we assume a linear dependency between a large trade and the change of the market price. That means, we use the following stock price model with Geometric Brownian motion:
model p_GBM
 export GBM_with_feedback
 export Delta

 TimeGrid     = [1/250:1/250:1] % Daily time steps
 r            = 0.02            % Risk free rate
 InitialValue = 100             % Initial Stock price
 Sigma        = 0.2             % Volatility without feedback effect
 Multiplier   = 30              % Size of price change

 GBM = InitialValue             % GBM is the stock price process
 Delta_old = 0                  % initial position in option hedge

 % loop through all time steps
 loop t:TimeGrid
    theta t-@time
    GBM = GBM * exp((r-0.5*Sigma^2)*@dt + Sigma*sqrt(@dt)*randn())

    % Import Delta of Put option with Strike K=100 and Maturity T = 1.5
    call EuropeanPutAnalytic
       export GBM to S, 80 to K, Sigma, r to R, 1.5-@time to T
       import Delta from Delta

    ChangeInDelta = Delta-Delta_old
    Delta_old = Delta

    % Change GBM according to change in hedge portfolio
    GBM = GBM + Multiplier * ChangeInDelta
    GBM_with_feedback = GBM
 end
end
Using Theta Suite, we can now evaluate the p_GBM model by clicking on “Generate and Run”. Then, we see the Theta Suite Result Explorer and select “Probability Density”:
And we see the probability density distribution of the stock price in time: A bi-modal distribution.

Theta Suite Result Explorer: Probability Density for a Stock Price Process with Hedge Feedback – Hedging of a Put option with strike K=80 and initial stock price S = 100.
Looking at the individual paths, we see that the prices rise and fall quicker if they move towards the options strike at 80. In the following plot, we see this region high-lighted in red.

Theta Suite Result Explorer: Paths of Stock Price Process.
Conclusion
Using Theta Suite, it is simple to analyze the feedback effect of hedging an option: The hedging of capital market guarantees can significantly change the price process of the underlying. Especially, in illiquid markets, this effect can dominate the behavior of the stock prices. Looking at the volumes of traded options, the rising volatility in the markets might also be explained by increased hedging activities.


